Mass spectrometry-based imaging (MSI)*
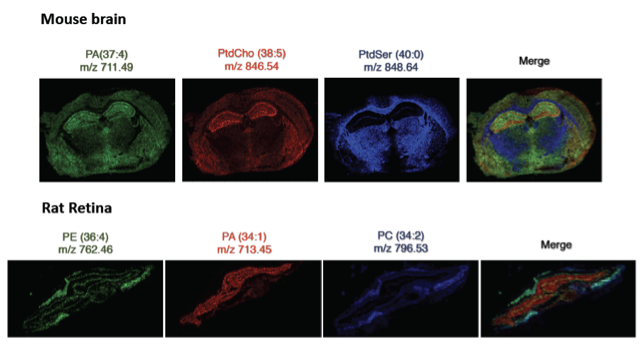
Spatially resolved analysis of metabolites, proteins, lipids, peptides, glycans and even drugs has become feasible with the development of mass spectrometry-based imaging strategies. Development and application of these techniques has been pioneered in medicinal and pharmacological research. MSI has allowed, for instance, the detection of novel clinical markers for better diagnosis of cancer tissues and to follow the spatial-temporal patterns of drug molecules used for pharmacological studies at cellular resolution.
Different versions of MSI approaches exist. All of them represent surface analysis techniques which are based on desorption and ionization of molecules followed by their subsequent MS data recording. After collecting a mass spectrum at one spot, the sample is moved to the neighboring spot, and the mass spectrum is sampled again, until the entire sample surface is scanned. By choosing a peak (a distinct m/z value) in the resulting spectra that corresponds to the compound of interest, the MS data is used to map its distribution across the sample. This results in pictures of the spatially resolved distribution of a compound pixel by pixel. Each data set contains a gallery of pictures because any peak in each spectrum can be spatially mapped. MSI therefore has the ability to detect thousands of different analytes in a single experiment. Furthermore, MSI can be applied to any kind of surface, polymers, metal or paper, and of course biological tissues, like histological sections or cells, for obtaining e.g. distribution maps of metabolites.
The most common technique applied for MSI of metabolites and peptides is MALDI MSI, involving the application of a suitable matrix substance on the surface. Spatial resolution achievable is depending on the chosen ionization technique and ranges from few nm (SIMS) to µm (MALDI, LA, DESI). Despite the fact that MSI has been generally considered a qualitative method, the signal generated by this technique is proportional to the relative abundance of the analyte and therefore, quantification is possible, but challenging.
Example applications are described here:
M.J.J. Haartmans et al., “Mass Spectrometry-based Biomarkers for Knee Osteoarthritis: A Systematic Review”, https://doi.org/10.1080/14789450.2021.1952868
- S.T.P. Mezger et al., “Trends in mass spectrometry imaging for cardiovascular diseases”, https://doi.org/10.1007/s00216-019-01780-8

- ALM Italian Node
- Austrian BioImaging / CMI (AT)
- Facility of Multimodal Imaging - AMMI Maastricht
- Finnish Advanced Microscopy Node
- NORMOLIM Node
- Swedish NMI Node
- UK Node
Use cases:
Use case |
Node |
DOI |
|---|---|---|
Proteomics analysis of human intestinal organoids during hypoxia and reoxygenation as a model to study ischemia-reperfusion injury |
Facility of Multimodal Imaging - AMMI Maastricht |