Magnetic Resonance Imaging (MRI)
Magnetic resonance imaging (MRI) is a non invasive imaging technique used to obtain 2D/3D "in vivo" images representing anatomy and physiological processes (e.g. dynamic perfusion or dynamic changes in blood oxygenation for functional brain mapping, metabolism etc), with high spatial and temporal resolution. MRI scanners use strong magnetic fields, radiofrequency pulses, and field gradients to generate images of soft tissues throughout the body.
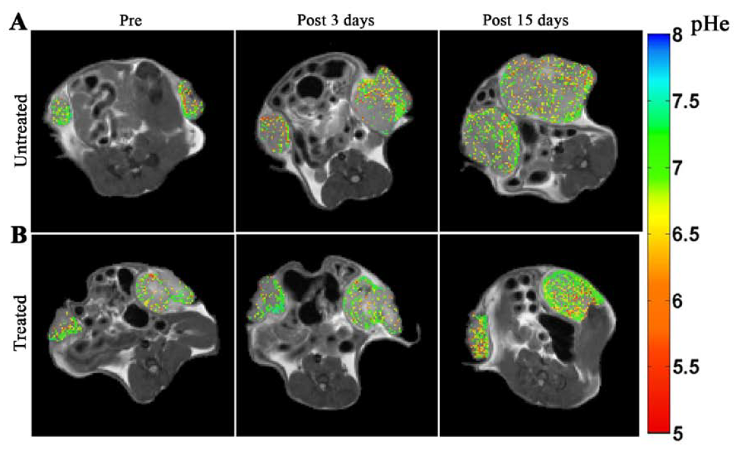
Contrast agents based on paramagnetic compounds are commonly used to enhance the signal/noise ratio and assess vascularization or tissue permeability. More recently, novel classes of contrast agents have been developed, such as hyperpolarized molecules for high sensitivity metabolic studies, or CEST agents for accurate pH parametric imaging.
Magnetic Resonance Spectroscopy (MRS) can be used to complement MRI in the characterization of tissues. While MRI makes use of water proton signals to create images, MRS uses either proton or heteronuclei signals to determine the relative concentrations of metabolites within a specific organ/tissue.
MRI scanners at high magnetic fields have the advantage to significantly increase the sensitivity and thus improve the image resolution and scan duration. MRS also benefits from high magnetic fields with an increased spectral resolution, which improves the separation between different chemical components. Nowadays, scanners at 3-7 Tesla are commonly used for both humans and animals, but for small-medium animal studies high field scanners operating at 7-9.4T are also quite common. Ultra-high field MR systems with fields of up to 17 T are also available mainly for preclinical studies.
In microMRI/MRS, the instruments are technically optimized for small animal studies, providing resolution in the mm to µm range.
MRI, either as a single modality or paired to other imaging modalities, is largely used for in vivo (humans and animals) studies and also for ex-vivo analysis of specimens (organs or tissue samples).
In preclinical imaging, animal models of various pathologies, from tumors to cardiovascular, neurological or metabolic disorders, are commonly used to monitor disease development and to test the efficacy of therapeutic treatments, to develop novel diagnostic tools etc. Several quantitative imaging biomarkers can be used to monitor disease progression over time.
Animal imaging can also be used for veterinary studies.
At clinical level, MRI is generally a key tool for the diagnosis of various pathologies and for monitoring the efficacy of new therapies. It is also commonly used in studies involving healthy volunteers to evaluate metabolism or functions.
MRI comprises a large number of techniques for various applications ranging from simple morphological measurements throughout all organs to the evaluation of complex systems, functions, and processes in living organisms.
Preclinical and ex-vivo MRI is provided by the following Nodes:
- Advanced Light Microscopy and Medical Imaging Node Brno CZ
- Austrian BioImaging / CMI (AT)
- Brain Imaging Network (BIN)
- Center for Advanced Preclinical Imaging (CAPI)
- Digital Imaging Multimodal Platform Neuromed - DIMP NEUROMED
- Danish BioImaging (DK)
- Facility of Multimodal Imaging - AMMI Maastricht (NL)
- Finnish Biomedical Imaging Node (FI)
- Flanders BioImaging Node (BE)
- Medical and Preclinical Imaging Hungary (HU)
- Israel BioImaging (IL)
- Molecular Imaging Italian Node (IT)
- Population Imaging Node Valencia (ES)
- Preclinical Imaging Centre (PRIME) - Molecular Imaging Dutch Node
- NORMOLIM, Norwegian Molecular Imaging Infrastructure
- Swedish NMI (SE)
Human MRI is provided by the following Nodes:
- Advanced Light Microscopy and Medical Imaging Node Brno CZ
- Brain Imaging Network (BIN)
- Molecular Imaging Italian Node (IT)
- Finnish Biomedical Imaging Node (FI)
- Flanders BioImaging Node (BE)
- Dutch High Field Imaging Hub
- Israel BioImaging (IL)
- Population Imaging Node Valencia (ES)
- Swedish NMI (SE)
Use cases
Click here for Use Cases from our Nodes.
Contrast in MRI images is generated by the differences in the nuclear relaxation times of water protons (T1 and T2) across tissues. The image contrast can be controlled by changing the values of specific acquisition parameters, generally the echo time (TE) and the repetition time (TR). Depending on their values, it is possible to obtain images where the contrast and brightness are predominantly determined by the T1 or T2 properties of water in tissues (T1-weighted and T2-weighted images respectively).
Contrast agents are frequently administered to enhance the contrast for assessment of organ functions (perfusion, vascularity, permeability) or better delineation of specific lesions or tissues. Mainly Gd based molecules are used with the acquisition of T1-weighted images and for specific cases iron Oxides could be used with T2-weighted images.
The acquisition of anatomical MR images is done with the scope of obtaining detailed morphological information ( shape, size, volume, texture…) of various body regions or lesions (e.g. tumors, ischemia, cysts etc) and to monitor disease progression or regression.
Kinnunen K. M., et al. "Volumetric MRI-Based Biomarkers in Huntington's Disease: An Evidentiary Review", https://doi.org/10.3389/fneur.2021.712555
McCarthy J., et al. "Morphometric MRI as a diagnostic biomarker of frontotemporal dementia: A systematic review to determine clinical applicability", https://doi.org/10.1016/j.nicl.2018.08.028
While MR images are typically assessed in a qualitative way, MRI can collect quantitative information about tissue properties. The range of properties includes the magnetic resonance (MR) relaxation times T1 and T2, T2*, diffusion, perfusion, fat and water fractions, iron fraction, elastic properties of tissue, temperature, chemical composition, and chemical exchange, just to mention some. Of note, new MRI methods are constantly being developed. By using the sensitivity of MRI to these tissue properties, it is possible to generate quantitative maps instead of qualitative anatomical images, where the intensity of each pixel corresponds to a measurement of one specific physical or physiological property. Quantitative measurements could help not only for identifying anatomical abnormalities but also for detecting initial loss of function or tissue alteration.
Available at:
- Advanced Light Microscopy and Medical Imaging Node Brno CZ
- Austrian BioImaging / CMI (AT)
- Center for Advanced Preclinical Imaging (CAPI)
- Digital Imaging Multimodal Platform Neuromed - DIMP NEUROMED
- Danish BioImaging (DK)
- Facility of Multimodal Imaging - AMMI Maastricht (NL)
- Finnish Biomedical Imaging Node (FI)
- Flanders BioImaging Node (BE)
- Medical and Preclinical Imaging Hungary (HU)
- Israel BioImaging (IL)
- Molecular Imaging Italian Node (IT)
- Preclinical Imaging Centre (PRIME) - Molecular Imaging Dutch Node
- NORMOLIM, Norwegian Molecular Imaging Infrastructure
- Dutch High Field Imaging Hub
- Medical and Preclinicial Imaging Hungary
The signal intensity in MR images is a function of water content, tissue properties and of MRI acquisition parameters.
For quantitative MR imaging, tissue relaxation times are measured by extracting the signal exponential decay (T2 or T2*) or recovery (T1) from multiple measurements. T1, T2 and/or T1rho parametric images can be acquired.
The quantification of relaxation times provides more detailed information on the tissue characteristics (tumor cells invasion, ischemic lesions, vascular leakage, iron deposition, inflammation etc), thus supporting the clinicians in the diagnostic process. Furthermore, relaxation maps are used to quantitatively assess the presence of exogenous contrast agents.
Example applications:
Evaluation of the structural integrity of the extracellular matrix in cartilage (T.J. Moshet et al., “Cartilage MRI T2 Relaxation Time Mapping: Overview and Applications” Seminars in Musculoskeletal Radiology, 2004, 8, 355) and of myocardial pathologies (https://doi.org/10.1016/j.jcmg.2013.05.005).
-
Detection of initial nerve degeneration in ALS (N. Riva et al., “Defining peripheral nervous system dysfunction in the SOD-1G93A transgenic rat model of amyotrophic lateral sclerosis”, https://doi.org/10.1097/nen.0000000000000081)
Detection of macrophage activities after a corneal lesion (G. Ferrari et al., “Ocular surface injury induces inflammation in the brain: in vivo and ex vivo evidence of a corneal-trigeminal axis”, https://doi.org/10.1167/iovs.14-13984)
-
R.P.M. Moonen et al., “Spin‐lock MR enhances the detection sensitivity of superparamagnetic iron oxide particles”, https://doi.org/10.1002/mrm.25544

Available at:
- Advanced Light Microscopy and Medical Imaging Node Brno CZ
- Austrian BioImaging / CMI (AT)
- Center for Advanced Preclinical Imaging (CAPI)
- Danish BioImaging (DK)
- Facility of Multimodal Imaging - AMMI Maastricht (NL)
- Finnish Biomedical Imaging Node (FI)
- Flanders BioImaging Node (BE)
- Israel BioImaging (IL)
- Molecular Imaging Italian Node (IT)
- Dutch High Field Imaging Hub
- NORMOLIM
- Preclinical Imaging Centre (PRIME) - Molecular Imaging Dutch Node
Water molecules diffuse differently through tissues depending on their composition, integrity, architecture, and presence of barriers. Diffusion imaging is used to obtain important information about water movements within the architecture of tissues. This is achieved by using MRI sequences specifically designed to measure the values of the water diffusion coefficient (Diffusion Weighted Imaging) and its components along the 3D space (Diffusion Tensor imaging).
Neither contrast agents nor specific instrumentation are requested for this kind of experiments.
Diffusion MRI is used to evaluate the molecular function and micro-architecture of tissues, and it acts as a tool for monitoring treatment response and disease progression for a variety of pathologies such as tumors, white matter diseases, inflammatory diseases and so on. See for example:
- Baliyan V., et al. "Diffusion weighted imaging: Technique and applications.", http://dx.doi.org/10.4329/wjr.v8.i9.785
- Qiu A., et al. "Diffusion Tensor Imaging for Understanding Brain Development in Early Life", https://doi.org/10.1146/annurev-psych-010814-015340
Available at:
- Advanced Light Microscopy and Medical Imaging Node Brno CZ
- Austrian BioImaging / CMI (AT)
- Center for Advanced Preclinical Imaging (CAPI)
- Danish BioImaging (DK)
- Facility of Multimodal Imaging - AMMI Maastricht (NL)
- Finnish Biomedical Imaging Node (FI)
- Flanders BioImaging Node (BE)
- Israel BioImaging (IL)
- Molecular Imaging Italian Node (IT)
- Dutch High Field Imaging Hub
- NORMOLIM
- Medical and Preclinicial Imaging Hungary
- Preclinical Imaging Centre (PRIME) - Molecular Imaging Dutch Node
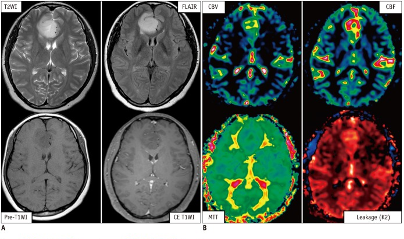
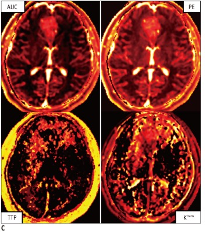
The decrease of the MRI signal in a given tissue after injection of a T1 or T2* contrast agent can be exploited to provide, after suitable post-processing which affords parametric maps of quantities such as blood volume, blood flow, mean transit time and others, a wealth of information about organ perfusion.
Perfusion MRI can be performed either with or without the use of an exogenous contrast agent. In the first case, dynamic susceptibility contrast (DSC)-MRI, which measures the signal loss in T2- or T2*-weighted images, and dynamic contrast-enhanced (DCE)-MRI, which measures the signal loss in T1-weighted images, are used. In the latter case, arterial spin-labeling (ASL) is used.
While ASL is mainly applied for the measurement of cerebral perfusion, DSC and DCE-MRI are used in a wider variety of clinical applications, including the classification of tumors, stroke regions, and characterization of other diseases, as well as for assessing response to antiangiogenic therapies.
Boxerman J.L., et al. "Dynamic Susceptibility Contrast MR Imaging in Glioma: Review of Current Clinical Practice." http://dx.doi.org/10.1016/j.media.2016.06.005
Sujlana, et al. "Review of dynamic contrast-enhanced MRI: Technical aspects and applications in the musculoskeletal system", https://doi.org/10.1002/jmri.25810
In neurology, brain perfusion parameters such as Normalized Cerebral Blood Flow (NCBF) and Cerebral Blood Volume (CBV) are relevant hemodynamic parameters, as their changes can precede abnormalities on conventional MR imaging. Thus, knowledge of whether a lesion identified in anatomic images is associated with increased or decreased CBF or CBV can frequently help narrow the differential diagnosis.


Available at:
- Advanced Light Microscopy and Medical Imaging Node Brno CZ
- Brain Imaging Network (BIN)
- Danish BioImaging (DK)
- Finnish Biomedical Imaging Node (FI)
- Flanders BioImaging Node (BE)
- Israel BioImaging (IL)
- Molecular Imaging Italian Node (IT)
- Dutch High Field Imaging Hub
- Preclinical Imaging Centre (PRIME) - Molecular Imaging Dutch Node
fMRI measures metabolic changes in the brain caused by neural activity. It is typically based on dynamic measurement of brain with BOLD (blood oxygenation level dependent) contrast which is achievable with T2* weighted images (e.g. GRE EPI). Other contrast principles can be used as well (e.g. blood perfusion). Typical spatial resolution ranges from 3 x 3 x 3 mm to 2 x 2 x 2 mm in whole brain coverage, or even up to 0.1 mm in limited field of view and at ultra-high fields (7T or more). Temporal resolution ranges from 3 s to 0.5 s with EPI sequence.
fMRI can be used in medical research (and diagnostics) as well as psychology, neuroeconomy, and other disciplines related to understanding human brain and behavior. It is typically used to measure neural activity during tasks or following to stimuli (e.g. scenario with auditory, visual or tactile stimuli distributed during the acquisition time to induce required brain activity), but resting-state fMRI is possible too. It allows to obtain activation maps, evaluate the hemodynamic response in selected regions, estimate the functional connection among brain regions, and evaluate the relationship between activity/connectivity and external variables.
fMRI can be combined with electrophysiological recordings or stimulation. A special case is fMRI hyperscanning (dual fMRI) with two participants measured simultaneously in two scanners.
Example applications include:
localization of brain functions and networks
monitoring brain changes caused by stress
discovering brain changes in various diseases (e.g. Alzheimer disease, Schizophrenia etc)
understanding empathy, emotions and consciousness
understanding the learning process
observing brain plasticity, development, aging affects
Available at:
- Advanced Light Microscopy and Medical Imaging Node Brno CZ
- Austrian BioImaging / CMI (AT)
- Brain Imaging Network (BIN)
- Danish BioImaging (DK)
- Finnish Biomedical Imaging Node (FI)
- Flanders BioImaging Node (BE)
- Israel BioImaging (IL)
- Molecular Imaging Italian Node (IT)
- Dutch High Field Imaging Hub
- Medical and Preclinicial Imaging Hungary
- Preclinical Imaging Centre (PRIME) - Molecular Imaging Dutch Node
In CEST imaging, a radiofrequency pulse is applied at the resonant frequency(ies) of exchangeable protons in a given molecule or metabolite, in order to reach a saturation state. Chemical exchange of the protons with those of water molecules causes the transfer of magnetic saturation to water over time. The subsequent decrease in water signal is detected by standard MR imaging sequences and provides an indirect measure of the concentration of the species of interest.
CEST MRI can detect a variety of endogenous small molecules (e.g. glucose, glycogen, lactate, creatine, glutamate), proteins and enzymes for molecular imaging. Development of exogenous CEST agents, including diamagnetic CEST (DIACEST), paramagnetic CEST (PARACEST) and liposome-based (LIPOCEST) agents, greatly enhanced the sensitivity and specificity of CEST imaging (Longo D.L. et al.; “A snapshot of the vast array of diamagnetic CEST MRI contrast agents” https://doi.org/10.1002/nbm.4715; Ferrauto G. et al.; “LipoCEST and cellCEST imaging agents: opportunities and challenges” https://doi.org/10.1002/wnan.1385).
CEST imaging can provide information on tissue pH, temperature, oxygenation, metabolism, enzymatic reactions as well as for molecular imaging applications. Example applications include several disorders such as acute stroke, renal injury, tumors and multiple sclerosis.

Magnetization transfer (MT) is based on the observation of the immobile (restricted) hydrogen pool (protons bound to large macromolecular proteins and lipids, such as those found in such cellular membranes as myelin) throughout saturation of this restricted pool and detection on the mobile proton pool. The MT contrast is different from T1, T2, and PD, and it likely reflects the structural integrity of the tissue being imaged. Applications include tissue characterization, such as evaluation of multiple sclerosis and other white-matter lesions and in tumors.
See also: van Zijl PCM et al.; “Magnetization Transfer Contrast and Chemical Exchange Saturation Transfer MRI. Features and analysis of the field-dependent saturation spectrum” https://doi.org/10.1016/j.neur...
Available at:
- Advanced Light Microscopy and Medical Imaging Node Brno CZ
- Austrian BioImaging / CMI (AT)
- Center for Advanced Preclinical Imaging (CAPI)
- Danish BioImaging (DK)
- Finnish Biomedical Imaging Node (FI)
- Flanders BioImaging Node (BE)
- Molecular Imaging Italian Node (IT)
- Dutch High Field Imaging Hub
- Preclinical Imaging Centre (PRIME) - Molecular Imaging Dutch Node
Magnetic Resonance Spectroscopy Imaging is used to spatially map multiple tissue metabolites signals. Since the molecular concentrations of these metabolites are at least 10.000 times lower than water, they produce correspondingly much lower signal strengths. Thus, to detect enough signal above noise for quantification, 1H-MRSI must use much larger voxel sizes in comparison to MRI, leading to lower spatial resolution with respect to anatomical imaging. The use of high magnetic fields allows to overcome this issue. MRSI is used in the clinics for quantifying metabolic abnormalities in the human brain, prostate, breast and other organs.
See for example:
T.A.A. Boroeders et al., “Glutamate levels across deep brain structures in patients with a psychotic disorder and its relation with cognitive functioning”, http://dx.doi.org/10.1101/2021...
A.A. Bhogal et al., “Lipid-suppressed and tissue-fraction corrected metabolic distributions in human central brain structures using 2D 1H magnetic resonance spectroscopic imaging at 7 T”, http://dx.doi.org/10.1002/brb3...
Available at:
- Advanced Light Microscopy and Medical Imaging Node Brno CZ
- Brain Imaging Network (BIN)
- Center for Advanced Preclinical Imaging (CAPI)
- Danish BioImaging (DK)
- Finnish Biomedical Imaging Node (FI)
- Flanders BioImaging Node (BE)
- Molecular Imaging Italian Node (IT)
- Israel BioImaging
- Dutch High Field Imaging Hub
- Medical and Preclinicial Imaging Hungary
- Preclinical Imaging Centre (PRIME) - Molecular Imaging Dutch Node
Among all the nuclei found in the human body that have a non-zero nuclear spin (e.g., 1H, 13C, 17O, 19F, 23Na, 31P), hydrogen is by far the dominant nucleus of interest for clinical MRI. Nevertheless, technological progress, development of acquisition methods and the availability of equipment operating at high magnetic fields have made in vivo heteronuclear MRI/MRS possible in both humans and small animals despite sensitivity limitation, widening the number of applications and the range of metabolites that can be mapped by MRS.
Sodium (23Na) MRI has been applied in a large variety of biomedical/clinical research areas. Sodium ions (Na+) play an important role in many cellular physiological processes. An unbalanced concentration gradient across the cell membranes or an increase in the intracellular Na+ content is an early marker of cell viability in many disease processes. 23Na-MRI can be used for studying heart diseases, by exploiting the increase in the extracellular sodium signal in acute ischemia, for cancer investigations, by measuring the increase of sodium content in proliferating cells, and for testing therapies by evaluating the intracellular sodium accumulation due to cell death https://doi.org/10.1016%2Fj.jacr.2007.07.001).
31P MRS can be used to study the energetic metabolism of a wide range of tissues such as muscle, heart, liver, and kidney in various pathological contexts. Using the endogenous 31P signal arising from the tissue, it is possible to obtain information about the energy status and also determine the intracellular pH (from the chemical shift of Pi). 31P signals from inorganic phosphate, adenosine triphosphate, adenosine diphosphate, creatine phosphate and sugar phosphates can be observed in whole-cell preparations, intact tissues or organs. Phosphate metabolites that are involved in ATP production and utilization can be quantified non-invasively by 31P-MRS/MRI, while 31P magnetization transfer (MT) techniques allow in vivo measurement of metabolic fluxes via creatine kinase (CK) and ATP synthase (https://doi.org/10.21037%2Fqims.2017.11.03).
For 13C-MRI, hyperpolarized probes are usually used in order to increase the sensitivity of the technique (see Hyperpolarized MRI).
19F MRI is increasingly emerging as a multi-nuclear (1H/19F) technique that can be exploited for several purposes, e.g. cell tracking, detection of active inflammation, measuring tissue oxygenation and to study fluorinated pharmaceuticals. The lack of a 19F background signal in tissues affords an unequivocal detection suitable for quantification. Fluorine-based contrast agents can be engineered as nanoemulsions, nanocapsules, or nanoparticles to label cells in vitro or in vivo. Multispectral 19F-MRI using different fluorinated compounds could be also used to detect different labeled cells simultaneously. Specific fluorinated products can be used to map pO2 heterogeneity in tissues. (https://doi.org/10.1016/j.neuroscience.2021.03.016; https://doi.org/10.1016%2Fj.tibtech.2010.04.002)
Available at:
- Advanced Light Microscopy and Medical Imaging Node Brno CZ
- Center for Advanced Preclinical Imaging (CAPI)
- Molecular Imaging Italian Node (IT)
- Israel BioImaging
- Dutch High Field Imaging Hub
- Flanders BioImaging Node (BE)
- Medical and Preclinicial Imaging Hungary
- Preclinical Imaging Centre (PRIME) - Molecular Imaging Dutch Node
In respect to other imaging modalities, the major drawback of MRI is represented by the relatively low sensitivity of the technique. This is particularly true for nuclei other than protons. Hyperpolarized probes are molecules where the nuclei polarization has been artificially raised. Conversely to standard MRI contrast agents, which act on the relaxation of water protons, hyperpolarized molecules are themselves the source of the NMR signal, thus yielding to signal intensity and SNR that linearly depend upon their concentration and polarization level. Long relaxation times of the hyperpolarized nuclei are essential in order to preserve the polarization for as long as possible. For this reason HP-MRI relies on the detection of heteronuclei rather than protons. For most applications 13C-probes are used.
The use of hyperpolarized probes allows to obtain very strong signal enhancements, thus overcoming the MR sensitivity issue and making the detection of low concentration biological molecules possible. Hyperpolarized probes are usually employed for perfusion studies and for mapping metabolites and their transformations through MRS in the body. Hyperpolarized metabolic imaging is particularly useful for the early diagnosis of cancer and monitoring of treatments efficacy because it can reveal changes that happen well before the onset of macroscopic signs of the disease. A typical example is the monitoring of pyruvate and lactate levels after injection of hyperpolarized 13C-pyruvate.
Other examples of applications in the preclinical and clinical fields can be found in the following reviews:
Z.J. Wang et al., Hyperpolarized 13C MRI: State of the Art and Future Directions, https://doi.org/10.1148/radiol...
V.Z. Veloushei et al., Hyperpolarization MRI, https://doi.org/10.1097%2FRMR....
R. Woitek et al., The use of hyperpolarised 13C-MRI in clinical body imaging to probe cancer metabolism, https://doi.org/10.1038/s41416...
Available at:
Susceptibility Weighted Imaging (SWI) and Quantitative Susceptibility Mapping (QSM) are MRI techniques that measure and display differences in the magnetization that is induced in tissues, i.e. their magnetic susceptibility, when placed in the strong external magnetic field of an MRI system.
SWI produces images in which the contrast is heavily weighted by the intrinsic tissue magnetic susceptibility.
QSM is a further advancement of this technique that requires sophisticated post-processing in order to provide quantitative maps of tissue susceptibility.
SWI and QSM have been applied in a wide range of clinical applications in the neuroscience, cardiovascular and oncology fields.
For example, susceptibility-based techniques have a higher lesion contrast and sensitivity that leads to improved detection of cerebral haemorrhages when compared to conventional and magnitude-based techniques and/or CT; SWI is frequently used to image cerebral venous vascular networks, to better visualize and differentiate brain tumors from e.g. calcifications and to distinguish between types of tumors and metastasis.
Liver pathologies can also be studied by these methods, based on the changes in iron concentrations in the diseased liver.
Read more:
Ruetten P. P. R., et al. "Introduction to Quantitative Susceptibility Mapping and Susceptibility Weighted Imaging", https://doi.org/10.1259/bjr.20181016Available at:
Cardiovascular Magnetic Resonance (CMR) comprises a number of MRI techniques designed to assess various aspects of cardiac and vascular function, from cardiovascular morphology to ventricular function, myocardial perfusion, flow quantification and monitoring of coronary artery disease. A difference in respect to MRI of other body regions is that cardiac and respiratory motions cause artifacts. Thus, CMR requires synchronous cardiac and respiratory gating or breath-holding techniques. Cardiac synchronization with ECG is often used to “freeze” the hearth during MR acquisition.
MRI can also be used to record movies of the cardiac cycle that permit the extraction of a good number of dynamic cardiac parameters (cine MRI).
For more details on CMR techniques and applications see:
W.-Y.I. Tseng et al., “Introduction to Cardiovascular Magnetic Resonance: Technical Principles and Clinical Applications”, https://doi.org/10.6515%2FACS20150616A
Saeed M., Van T. A., Krug R., Hetts S.W., Wilson M.W. "Cardiac MR imaging: current status and future direction." https://doi.org/10.3978%2Fj.issn.2223-3652.2015.06.07
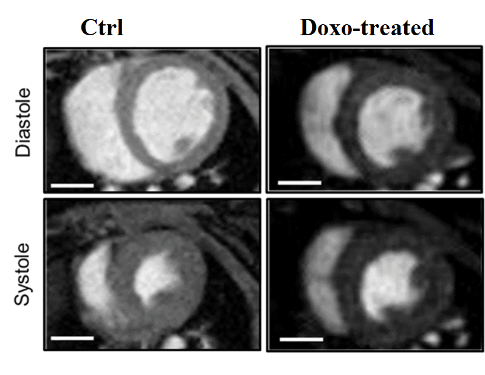
Cardiac MRI can also be successfully used to establish the eventual side effects of drugs on heart anatomy and physiology. For instance, it can be applied to assess the decrease of ejection fraction (EF%) in the heart upon multiple administrations of Doxorubicin for cancer treatment.

Available at:
- Advanced Light Microscopy and Medical Imaging Node Brno CZ
- Austrian BioImaging / CMI (AT)
- Center for Advanced Preclinical Imaging (CAPI)
- Danish BioImaging (DK)
- Brain Imaging Network (BIN)
- Finnish Biomedical Imaging Node (FI)
- Israel BioImaging (IL)
- Molecular Imaging Italian Node (IT)
- Dutch High Field Imaging Hub
- NORMOLIM
- Medical and Preclinicial Imaging Hungary
- Preclinical Imaging Centre (PRIME) - Molecular Imaging Dutch Node